

Juncture Wealth Strategies - Q1 2026 Market Commentary
2026 Outlook
Economic & Market Forecast
01 Economy
Leading indicators, consumer confidence, jobs, AI investment, productivity, and GDP
02 Inflation
Money supply trends and expected inflation for the year ahead
03 Bond Markets
Yield outlook and the Federal Reserve's path on interest rates
04 Equity Markets
Revenues, earnings, oil supply disruption, and sector leadership
05 2026 Market Direction
Our summary view across asset classes and the global outlook
Economy: Leading Economic Indicator (LEI)
The LEI continues to signal weakness in the US economy in 2026. The chart below reflects the divergence between the current (Coincident Economic Index, black line) versus future (LEI, blue line) expected economic growth. Current economic activity is at a much higher level than survey participants expect in the next six to twelve months.
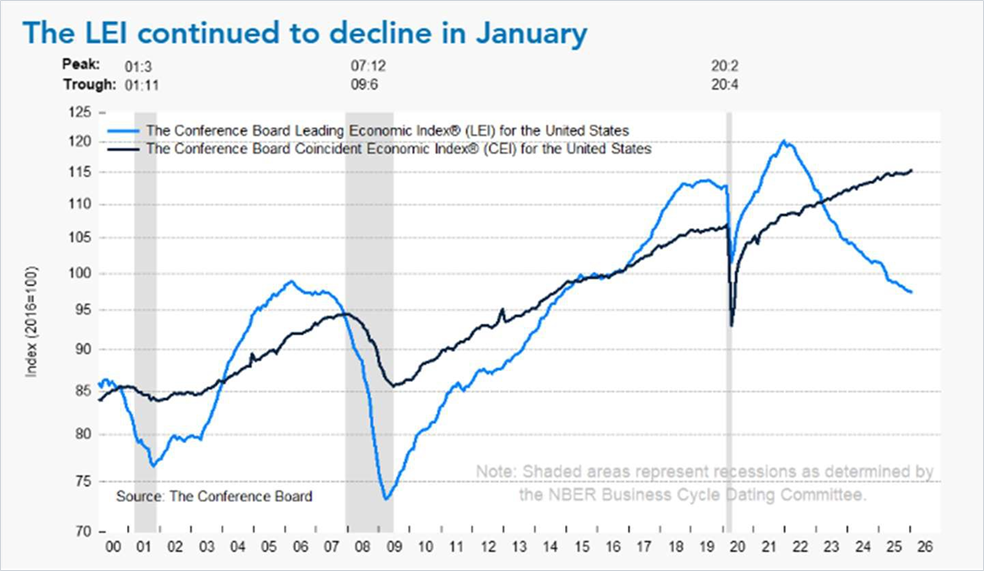
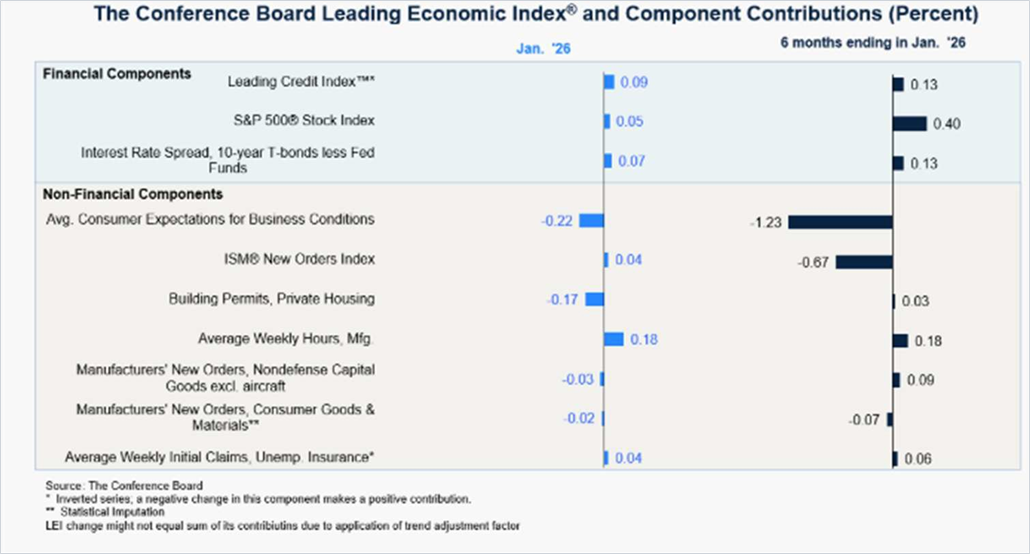
Economy: Leading Economic Indicator (con’t)
To enforce this point, this chart suggests that the US has struggled with recession-like conditions in some sectors. The slowdown has been broad-based with only the stock and bond market positively contributing to growth. Please note that the LEI may not capture the full effect of labor-enhancing technology which increases corporate earnings which leads to higher stock prices and, in turn, increased household wealth…which encourages spending. This may impact 2026 economic growth relative to current expectations.
Economy: Consumer Confidence Consumer confidence has been depressed even in the face of 1) higher wages, 2) a surging stock market and 3) a growing economy. It is possible that households are beginning to cope with lower savings. Generally, investors tend to swing from overly optimistic to overly pessimistic perceptions depending on the most recent environment. In this case, fewer jobs influence our mindsets. Fewer available jobs cause consumers to worry about paying for lifestyle products/services whether it be food, housing, gas or entertainment. This worry can lead to fear of investing as consumers may need available cash to pay for expenses rather than invest for long-term goals. Fear may also keep most stocks from being fairly-priced as the marginal investor isn’t buying. These conditions may describe our current situation even though the job market has normalized and interest rates are expected to be reduced this year. | 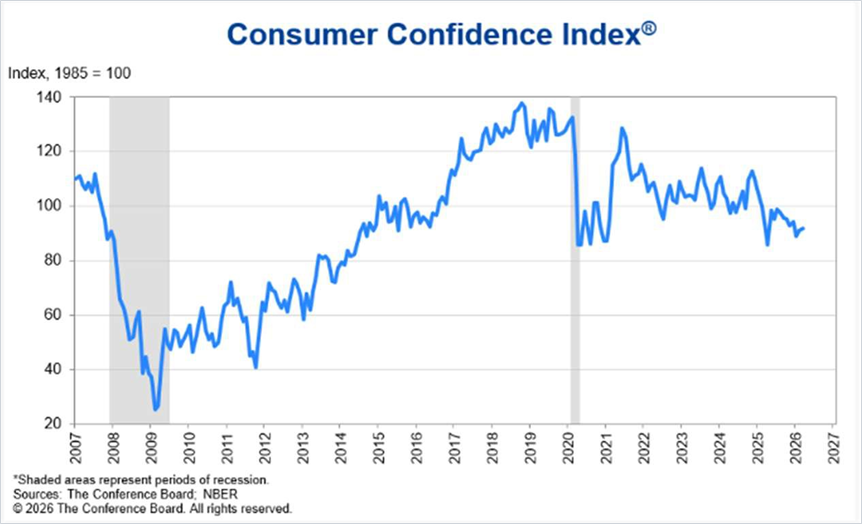 |
Economy: Jobs Consumer confidence has also been shaky this year as consumers digest a weaker job market even while the US has 0.9 job openings per unemployed worker. This exceeds the 20-year average of 0.72 jobs per unemployed worker. However, it is much lower than its peak of 2.0 set in March 2022 when companies found it difficult to recruit and retain employees due to the pandemic era relief financial support. One possible fear is that Artificial Intelligence will replace workers. Eventually, it will. It will also create other jobs. Because of this replacement, we do not see job market weakness negatively impacting the economy this year. | 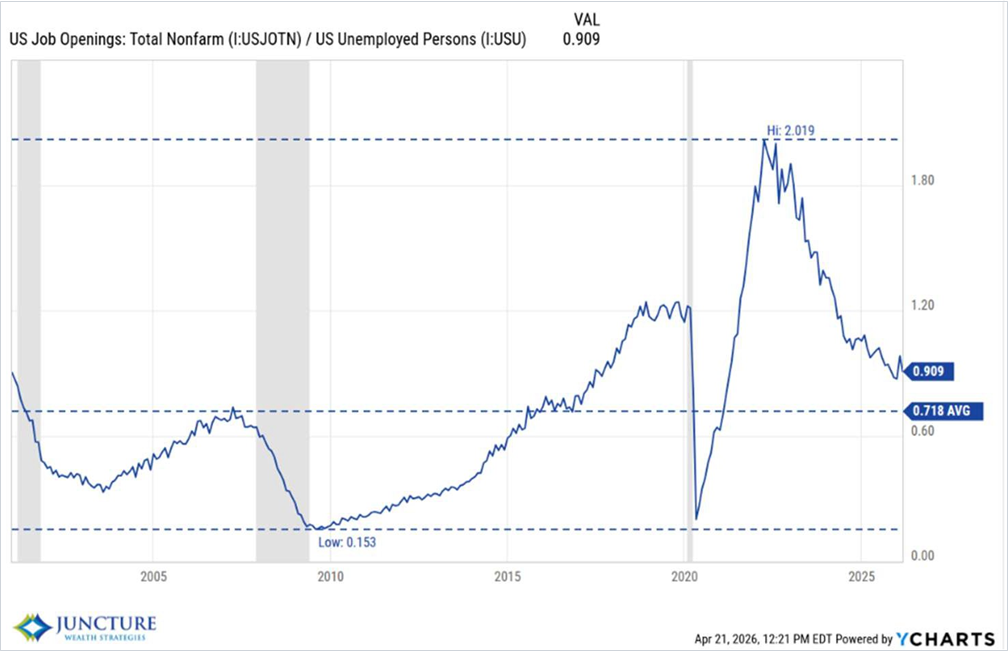 |
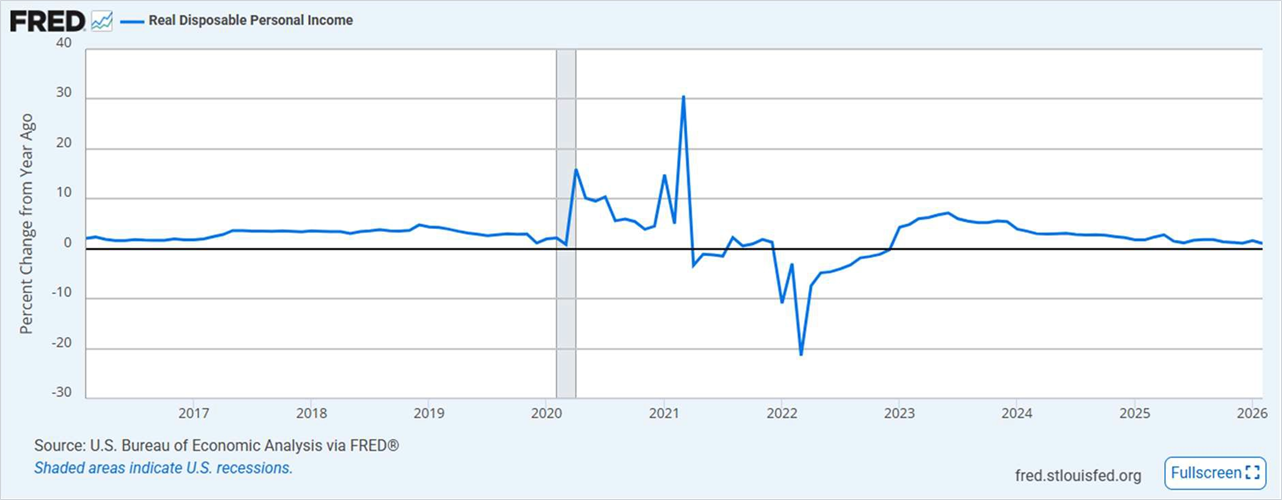
Economy: Household Spending
Another factor that households may be discounting in the Consumer Confidence survey is that real disposable income has been growing since 2023. This means that households' income growth is exceeding inflation by approximately 1% which should be mildly supportive of household spending.
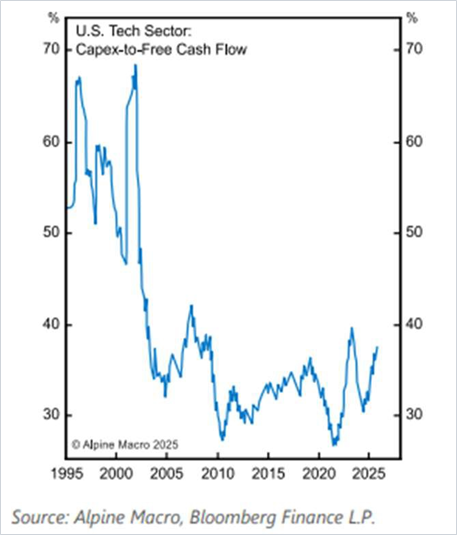
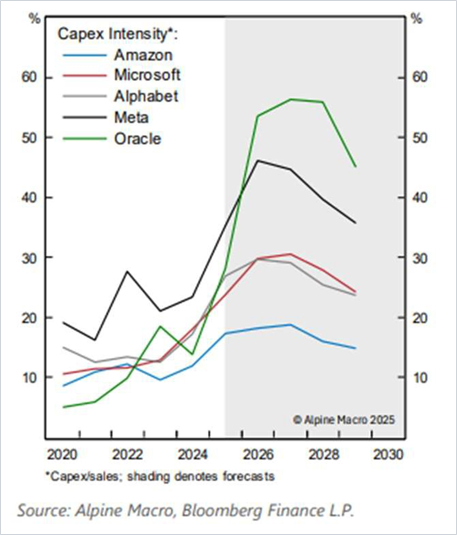
Economy: Artificial Intelligence
The last three years have introduced many investors to artificial intelligence (AI) opportunities. Many technology companies have adopted massive capital expenditure programs aimed at building AI infrastructure: chips, servers, data centers, energy producers. It is estimated that companies will invest roughly $500 billion in 2026, most of which is funded from current operating cash flows rather than debt financing. The media may begin to focus on other themes as the infrastructure takes time to build. Once the infrastructure is built, we will enter the second phase of the innovation wave: applications where robotics and mobility solutions will converge to transform our work and home lives in unexpected ways.
 |  |
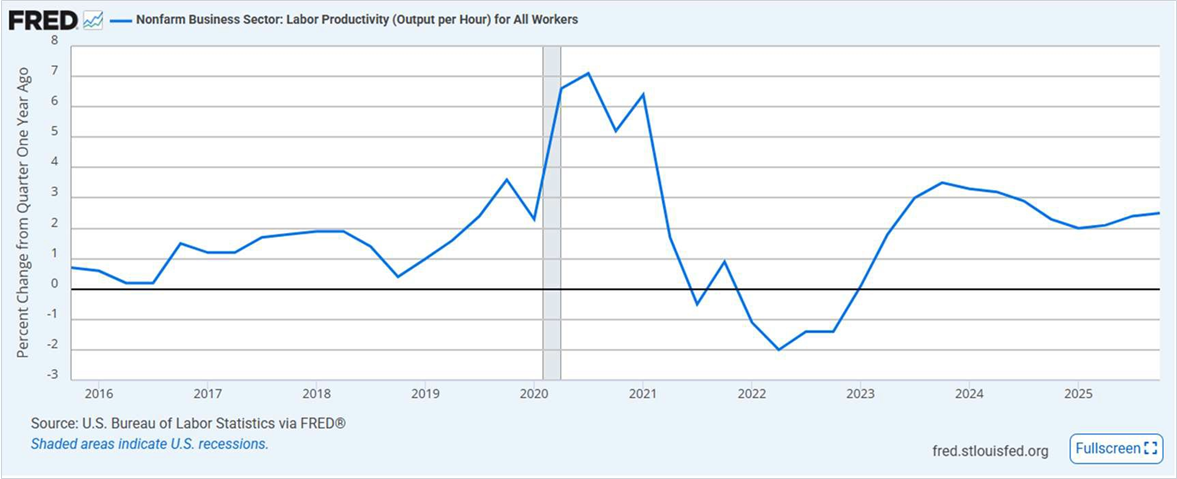
Economy: Productivity
The increased level of artificial intelligence (AI) investment will help support US and global productivity and economic growth in 2026. Productivity
may help companies maintain and grow their profit margins by restraining overall labor costs. This chart plots the labor productivity across the nonfarm business sector over the past ten years. Higher productivity generally correlates with higher company profits which supports higher stock market returns. As the AI trend progresses, companies will continue to become more efficient as AI replaces or augments humans by initially taking over repetitive tasks but progressing to more difficult ones. This trend could accelerate as AI begins to converge with robotics and mobility solutions in future years.
Economy: US Gross Domestic Product (GDP) The Conference Board’s 2026 US Economic Outlook suggests that the US real GDP growth will hit its low in the second quarter of 2026. After that, it should begin to strengthen. Our economy in 2026 partially relies on capital expenditures, solid real disposable income, and healthy household balance sheets. We continue to believe these trends will continue to support the US economy over the next few years. In conclusion, the economy will hit its nadir in the first part of the year and strengthen in the last half. The risk may be to an upside surprise if the consumer and productivity remains strong while capital expenditures continue their high pace. | 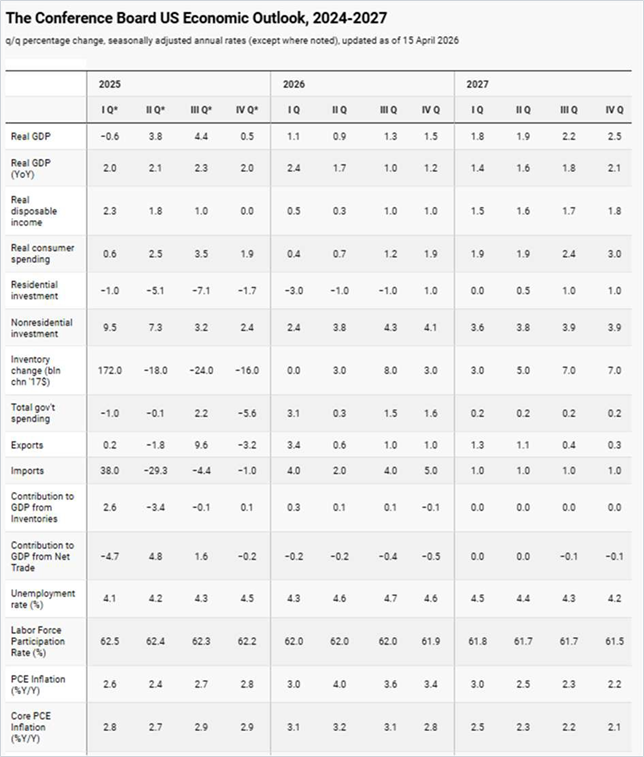 |
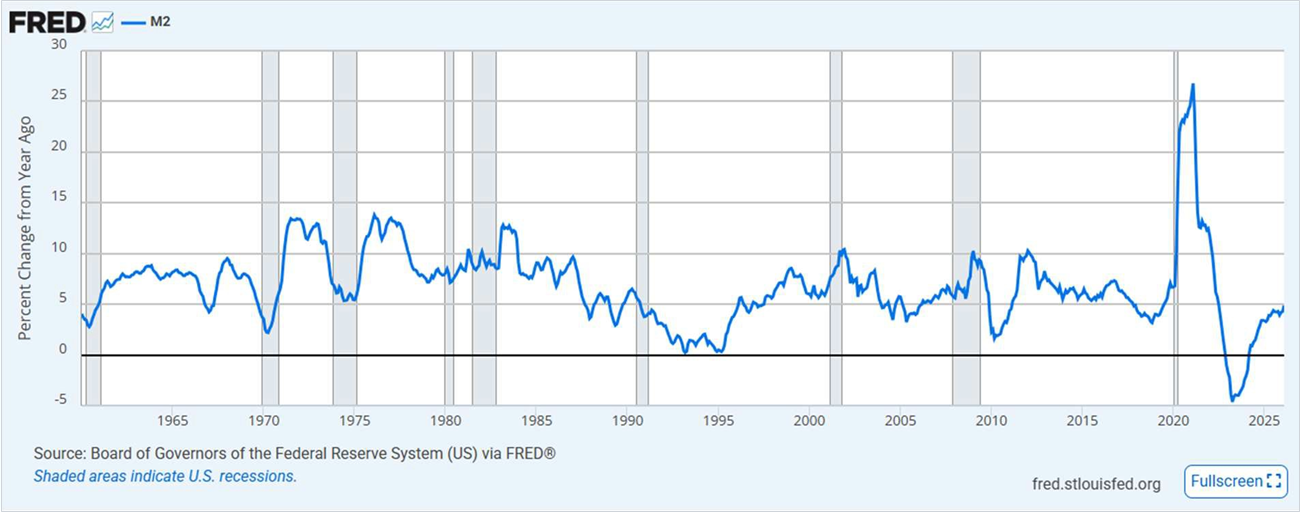
Inflation: Money Supply
Money supply is the fuel for inflation over a long period of time. We analyze the change in various money supply measures to assess the likelihood of future, persistent inflation. The M2 which is comprised of M1 (currency, checking and savings accounts) plus money markets and small CDs has settled into a 4.9% annual growth rate.
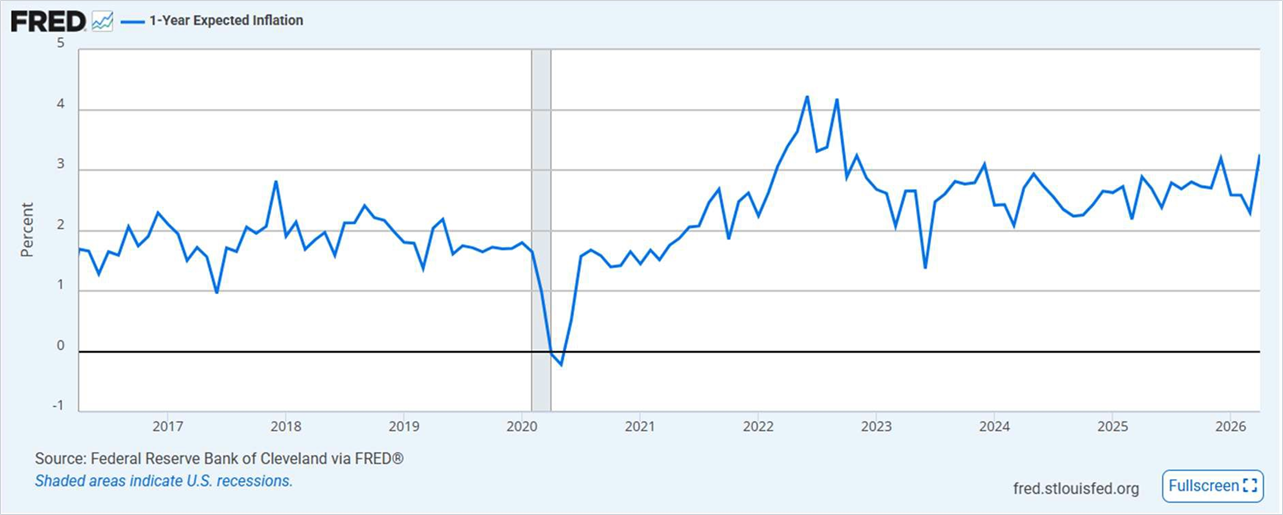
Inflation: Expected Inflation 2026
The expected inflation for 2026 currently is 3.25%. It has increased from 2.2% in March 2025. A combination of disrupted oil supply, increased tariff impact, decreased labor supply, and greater fiscal impulse have caused households and investors to expect stronger inflation in the year ahead. Shelter inflation should moderate the increase due to declining new rents in most markets. We could see an inflation surprise to the downside if labor market conditions worsen.
Bond Markets
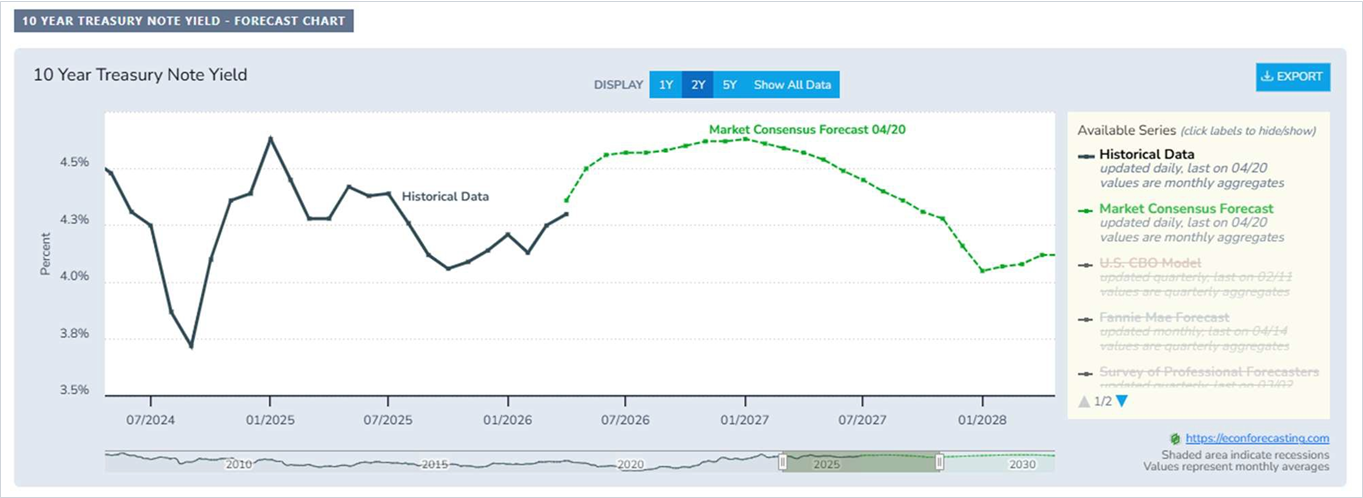
Bond yields are an important factor for the economy as they represent the cost of financing for companies and governments which need to raise capital. Investors are pricing in stable rates as the Federal Reserve pauses any rate decreases until it sees evidence of a slowing economy or continuing disinflation. The chart below shows that investors lack confidence in bond yield outcomes and, as such, are sticking with a range-bound yield forecast.
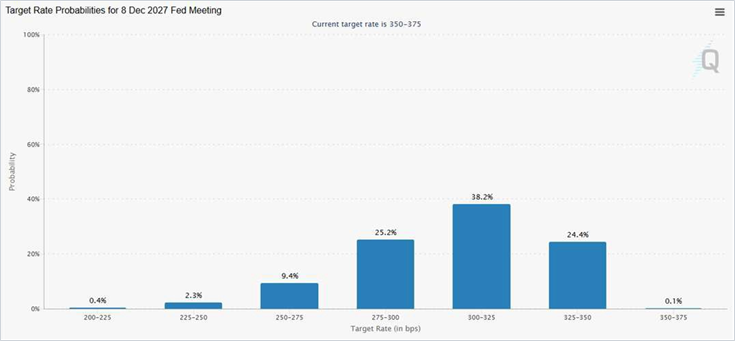
Bonds: Future Interest Rates Based on the disrupted oil supply and higher energy prices, bond traders continue to believe that the Federal Reserve will continue to hold interest rates steady for the remainder of the year. The top chart shows that 69% of market participants are positioned for steady rates. Contrast this chart with the one below which illustrates the Fed Funds rate at the end of 2027. As shown, traders believe that rates will experience between one and three cuts in 2027. This is a volatile measure and will change as more economic data is reported. We expect the Federal Reserve to hold interest rates steady until data confirms direction in economic conditions. | 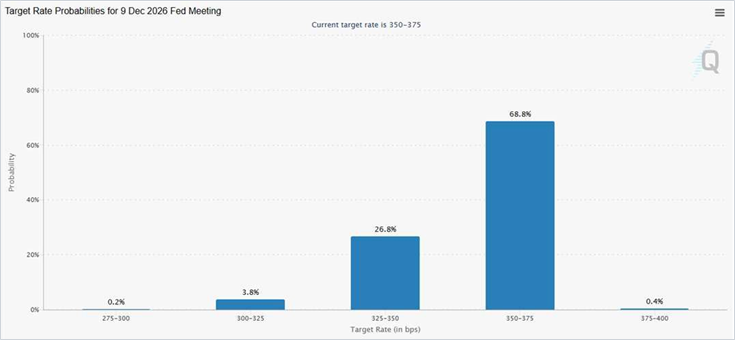 |
 |
Equities: Revenues and Earnings The stock market value is determined by earnings over the long-term. We have counseled clients to focus on the revenue and earnings growth when analyzing buy/sell decisions. The two charts show that stocks included in the S&P 500 continue to generate good earnings (≈13%) and revenue growth (≈10%). The US economy is undergoing an innovation wave with the advent and fusion of artificial intelligence, robotics, automated mobility solutions, etc. This trend will continue to be supportive of earnings and revenues over the next few years. In conclusion, we expect equities, overall, to have a good year as more stocks begin to participate in the AI movement. At the same time, we expect the Mag 8 (& cap weighted indices) to lag this rally and experience a transition from mega cap to large/small/mid cap stocks. | 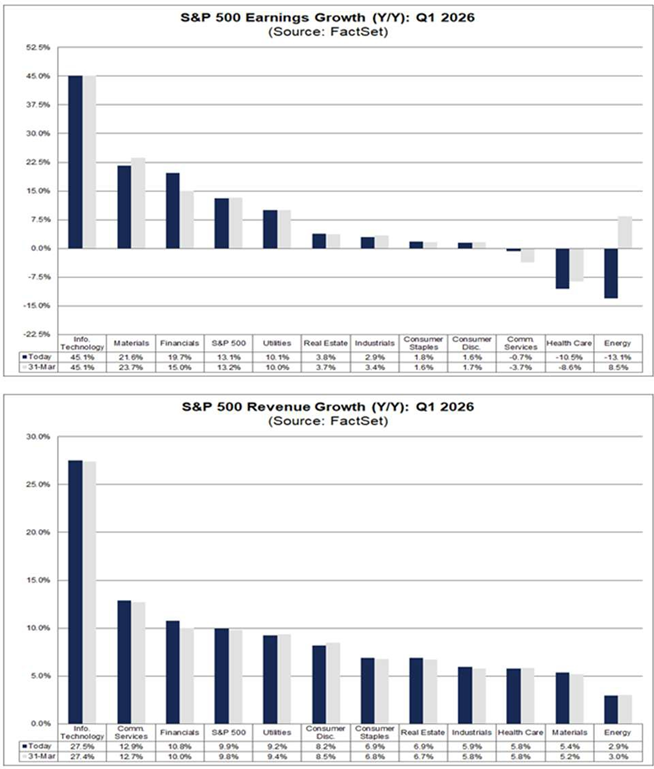 |
Equities: Oil The US/Israel-Iran war has disrupted the oil supply causing Brent crude oil prices to jump from $72 per barrel to $118 at its peak. Since the peak, it has settled into the $90 - $100 per barrel price range. Importantly, the long-term futures curve has adjusted upward as traders forecast a residual cost premium for oil that transits the Strait of Hormuz. At high oil prices, goods price inflation can reignite as the world reprices goods which rely on oil in its manufacture and distribution. | 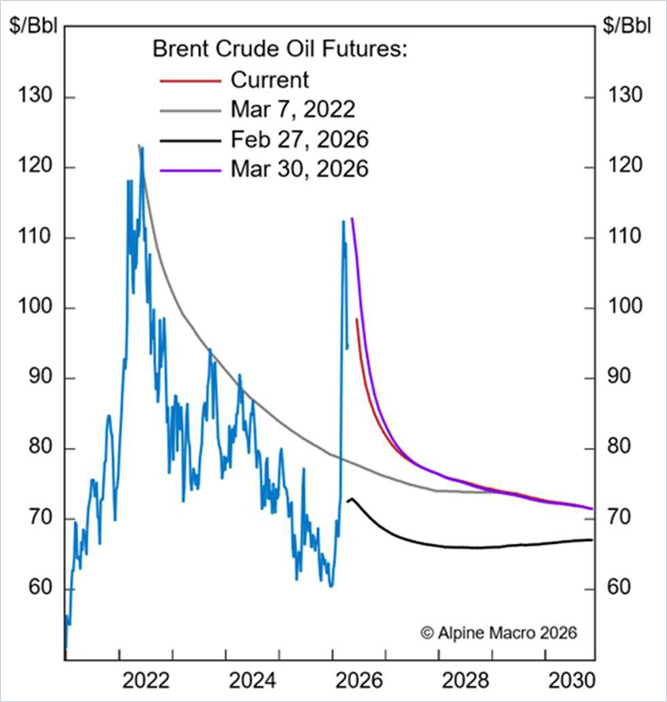 |
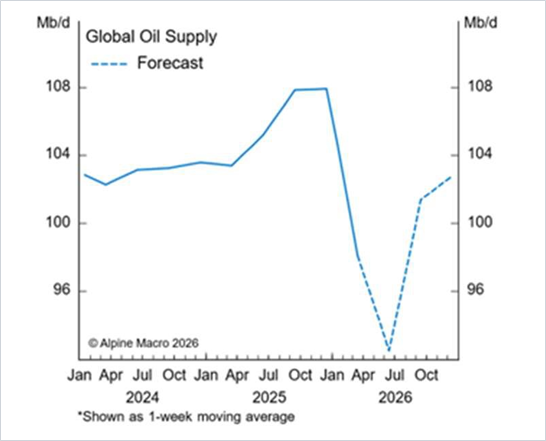
Equities: Oil Supply
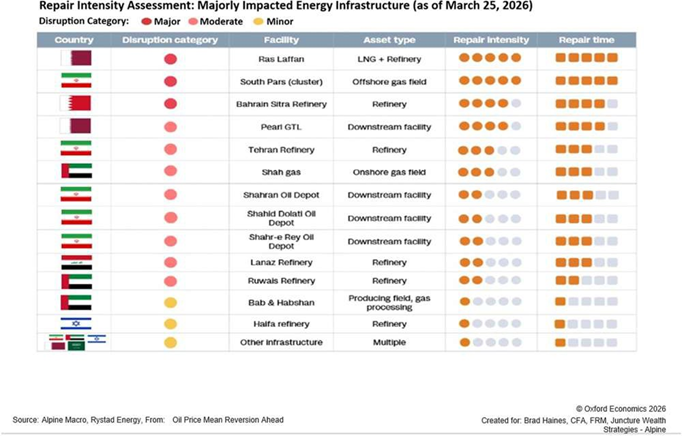
The damage to the oil and natural gas infrastructure has delayed how quickly oil supply can resume after the cessation of hostilities. The accompanying table shows the oil/natural gas facilities that have been damaged by Iran’s attacks. It will take some time for repairs to be completed and the oil/natural gas supply to return to pre-war levels. As such, we continue to believe that the oil supply disruption will take longer to return to normal levels than the market currently expects.
Depending on the outcome and complexion of the war’s end, investors might face a world of more oil supply than previously anticipated as Saudi Arabia uses the opportunity to regain market share lost since 2010. As such, we could see much lower oil prices a few years after the war’s end.
 |  |
Equities: Leadership The year-to-date sector leaders (energy, materials and industrials) have led primarily due to high oil prices and large artificial intelligence (AI) capital expenditures. However, once the war ends, we expect other sectors to regain equity market leadership (information technology, consumer discretionary, and communications) as the AI infrastructure and application buildout continues. The chart to the right shows the correlation between sectors vulnerable to crude oil prices and energy stocks. Energy stocks are struggling to maintain their recent highs as oil prices have declined. | 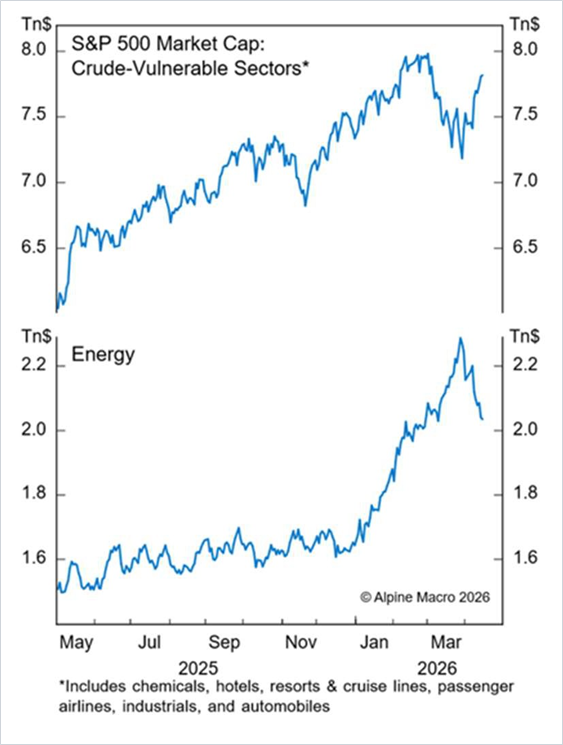 |
2026 Outlook Summary
JWS Market Direction
Equities |
|
Fixed Income |
|
Real Assets |
|
GDP Growth |
|
Inflation |
|
Interest Rates |
|
Geopolitics |
|
Disclaimer: This commentary is provided to you for informational purposes only and should not be considered investment advice, a recommendation to adopt any investment strategy, or a solicitation for services. Any specific firm or security presented should not be construed as an endorsement or recommendation by Juncture Wealth Strategies, LLC. No advice may be rendered by Juncture Wealth Strategies, LLC unless a client service agreement is in place. Please consult with your financial advisor before making any investment. Investing involves risk, including the possible loss of principal. Information provided by Bloomberg, YCharts, Alpine Micro, government data resources and other 3rd party economic data providers is believed to be reliable but the accuracy and completeness of the information cannot be guaranteed. For information pertaining to the registration status, fees, services or other information of JWS, please contact JWS or refer to the Investment Adviser Public Disclosure website (www.advisorinfo.sec/gov) for our disclosure statement as set forth on Form ADV.