

Juncture Wealth Strategies - November 2025 Market Update
Market Update
- Labor Markets are softening
- Money supply is growing at normal rates
- Monetary policy is slightly restrictive to economic growth
- Inflation should remain moderate
- Current inflation is estimated at 2%
- Shelter inflation should continue to decline as new rents are declining year over year
- Long term inflation expectations continue to be well-anchored, but are beginning to climb
- Interest rates are poised to decline over the next six to nine months.
- Equity and bond markets may experience volatility due to investor expectations of aggressive interest rate cuts over the next year. The markets may be expecting too many cuts given the economy and inflation.
- Mortgage rates may decline over the next year or two as rate cuts begin to spur real estate activity. This may translate into moderate residential real estate price gains.
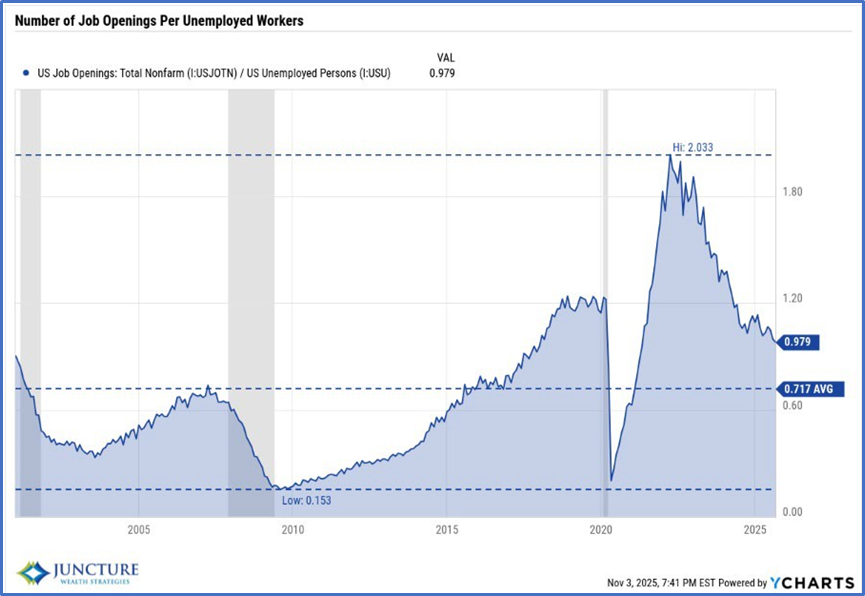
US Labor Market
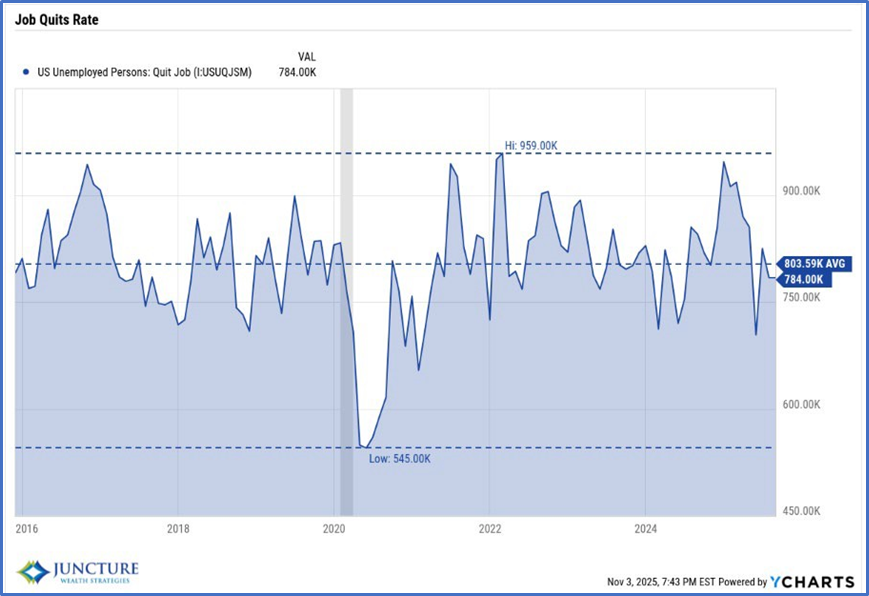
Prior to the federal government shutdown, the US labor market was becoming more balanced. The number of job openings to unemployed workers fell from a very high level of 2.0 to the most recent 0.98; approximately 1 job opening per unemployed worker which is still tighter than the long-term average of 0.72. An important metric is the number of workers quitting jobs. It may indicate workers’ perceptions of the ease of obtaining a new position. As such, low quit rates may portend weaker labor market conditions in the near term. The graph on the right shows the quit rate has declined from a high of almost 959k jobs to a recent of 784k jobs.
 |  |
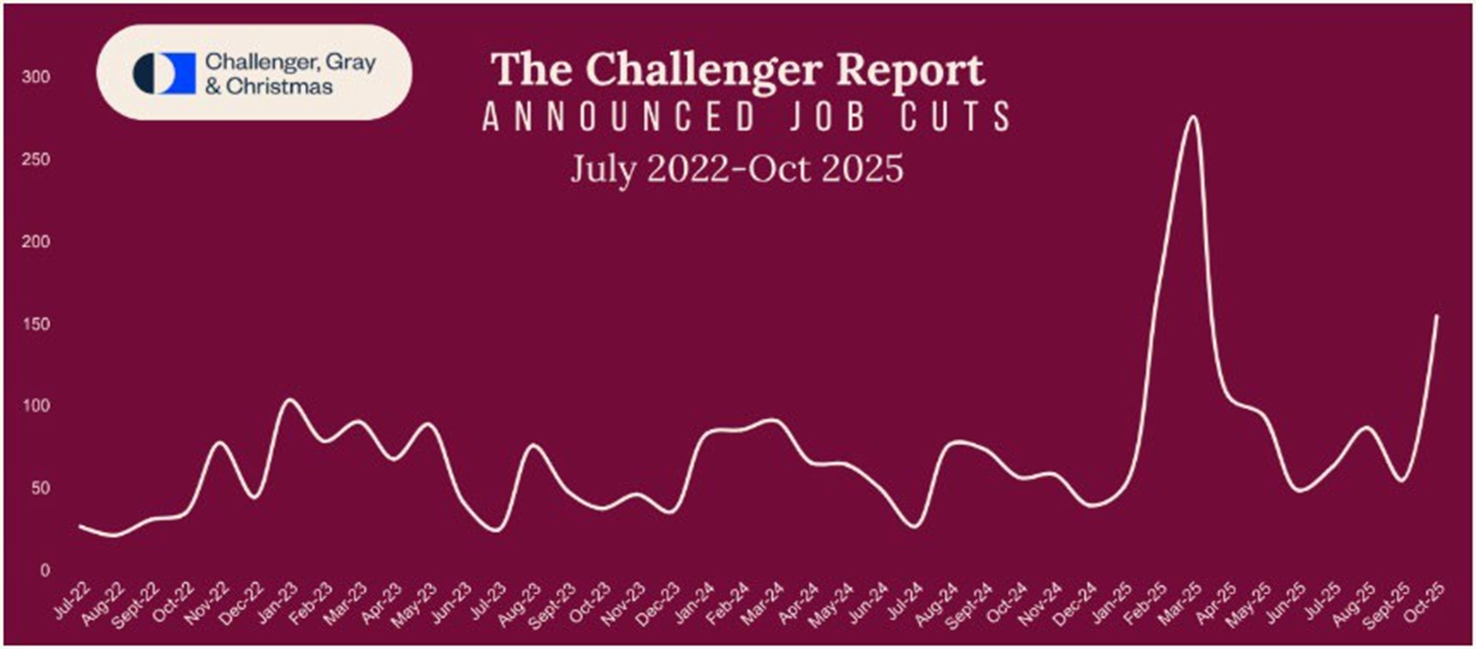
US Labor Market – Recent Layoff Announcements
Challenger, Gray & Christmas, a leading executive outplacement and coaching company, tabulates statistics on the labor market. Its most recent release reported 153, 074 jobs in October 2025 versus 55,597 in October 2024. The most cited reasons for these cuts included DOGE impact, artificial intelligence (AI), softening consumer/corporate spending, and rising costs.
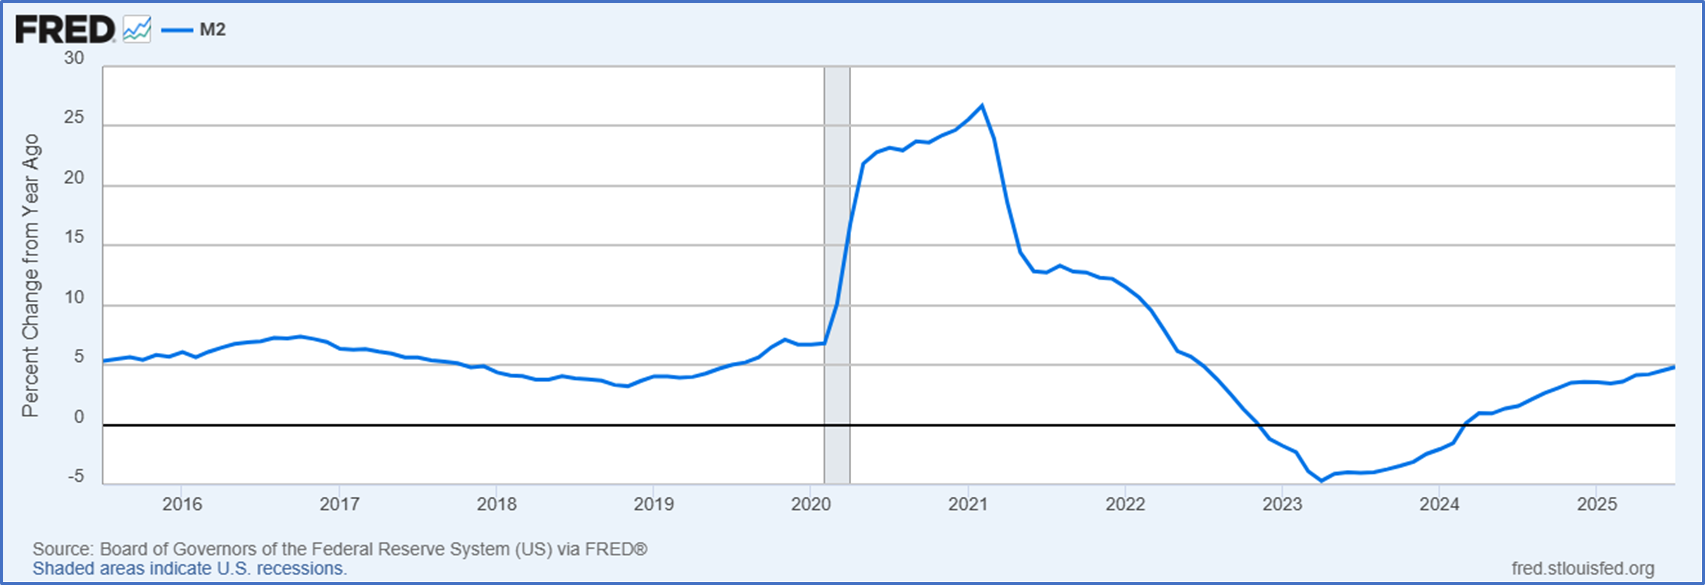
US Money Supply
As we have discussed in prior updates, persistent inflation must be reinforced by money supply growth. Over the past year, US M2 has begun to grow at approximately five percent. The M2 money supply consists of value of the following: currency, checking accounts, savings, small denomination time deposits (CDs), and retail money market funds. It can provide a picture of the level of liquidity available to support consumer spending. The current growth rate has returned to normal levels and should allow the economy to grow at a moderate pace without causing excess inflation.
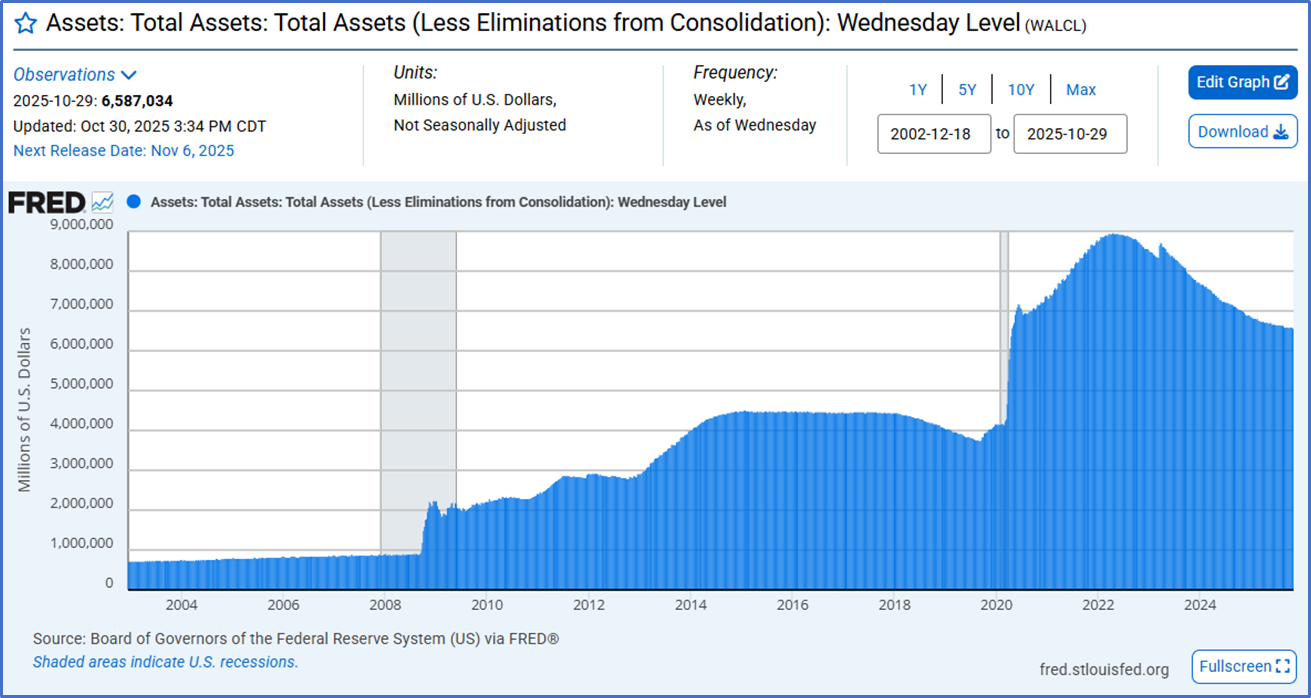
Federal Reserve Stops Quantitative Tightening
The Federal Reserve announced its intention to cease shrinking its balance sheet beginning in December. What impact will this action have on the economy? Generally, quantitative tightening takes money/liquidity out of the financial system. Liquidity is crucial to the normal functioning of the economy and financial markets. The Fed has taken approximately $2.5 trillion out of the system since 2022. Taking excess liquidity out of the system may have contributed to our recent low inflation rate.
Monetary Policy: Tight or Loose One indicator to assess how tight monetary policy is to subtract nominal economic growth (GDP) from the effective Federal Funds target rate. This provides the amount of excess liquidity to grow or contract economic growth relative to its current level. As such, if the indicator is positive, then it indicates that the liquidity is supportive of growing the economy relative to its current rate. If the indicator is negative, then liquidity does not support more growth. As of today, the measure indicates that monetary policy is slightly restrictive to economic growth. | 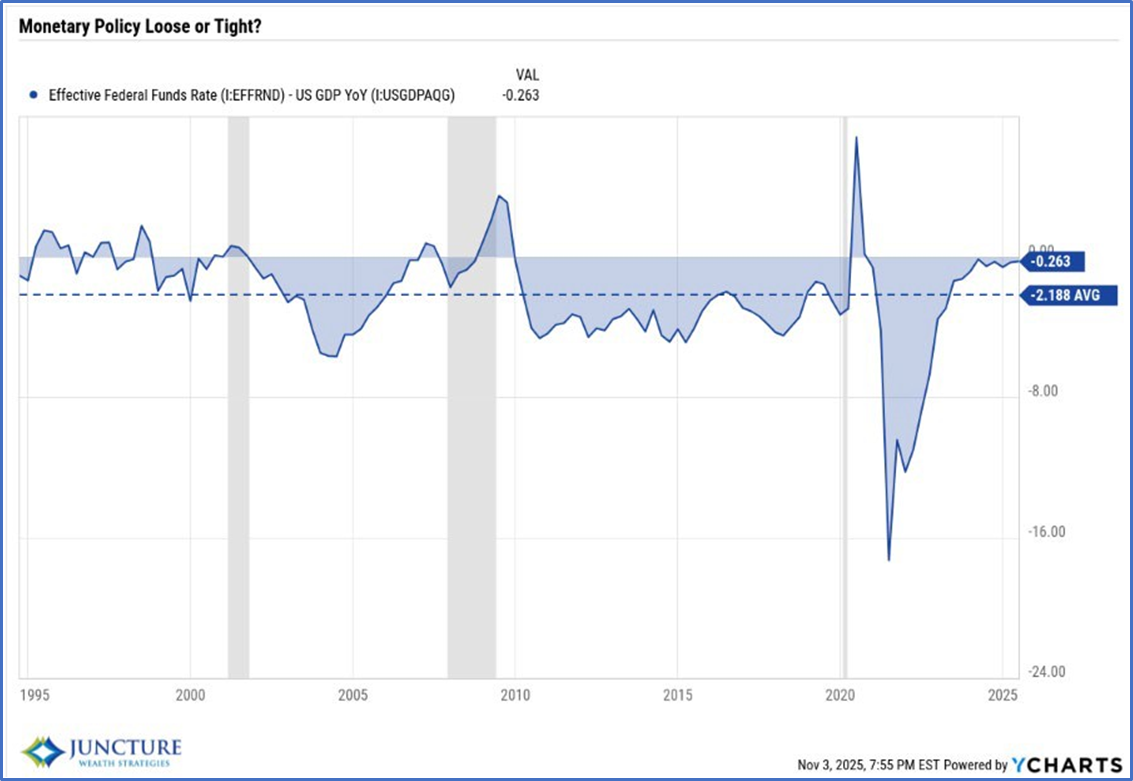 |
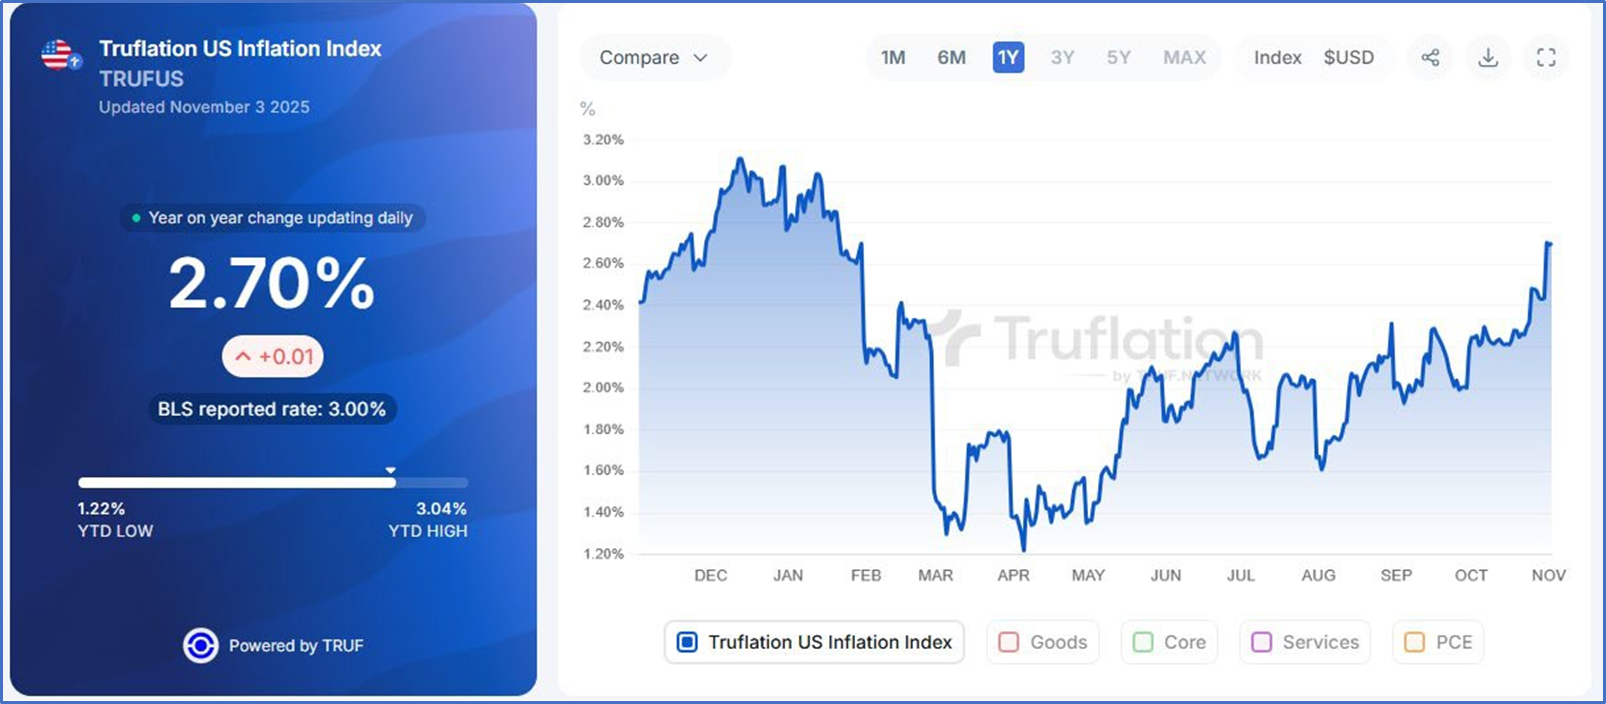
Inflation
Truflation tracks over 13 million data points nationally provided by 30 data providers to ascertain the best picture of inflation across the US. It segregates these data points into 12 household expenditure categories. It estimates US inflation to be between two and three percent which is close to the Federal Reserve’s inflation target of two percent.
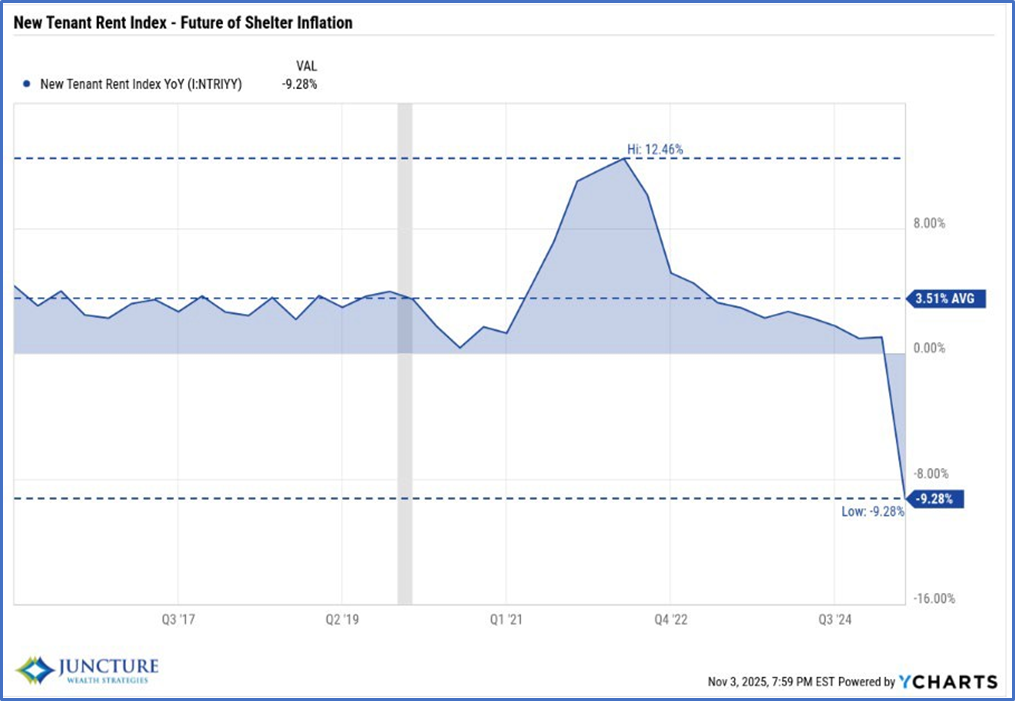
Inflation Expectations: Shelter
Shelter inflation has been a large contributor to overall inflation over the past few years. Being one of the largest components of the Consumer Price Index (CPI) and Personal Consumption Expenditure Index (PCE), shelter can significantly affect the overall level of inflation. The New Tenant Rent Index measures the rental rates that new tenants are paying and can provide insight as to the future path of shelter inflation and overall inflation. As shown below, shelter should continue to decline over the next 12 months which should restrain any tariff-related inflation pressures.
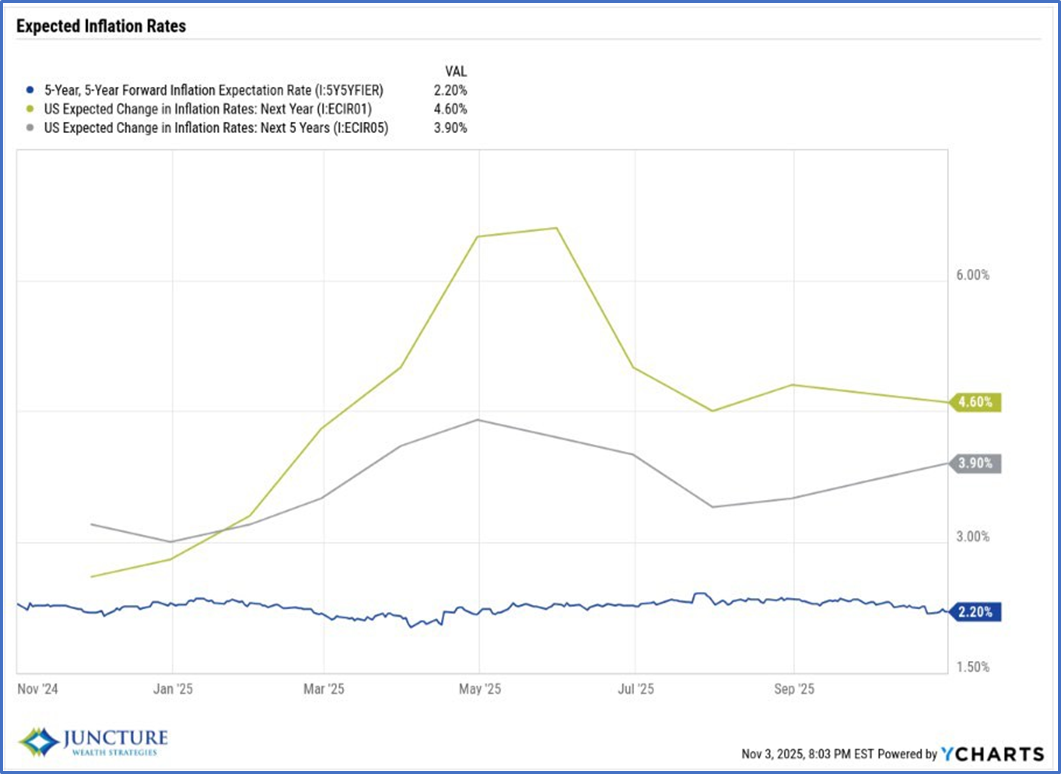
Inflation Expectations
Inflationary pressures will remain muted over the next few years as shelter inflation declines and economic growth moderates. The long-term inflation estimates illustrated to the right indicate that inflation should remain moderate although they have begun to move higher over the past few months. These measures are critically important as these estimates provide data for businesses, investors and lenders attempt to price inflation risk into all forms of contracts.
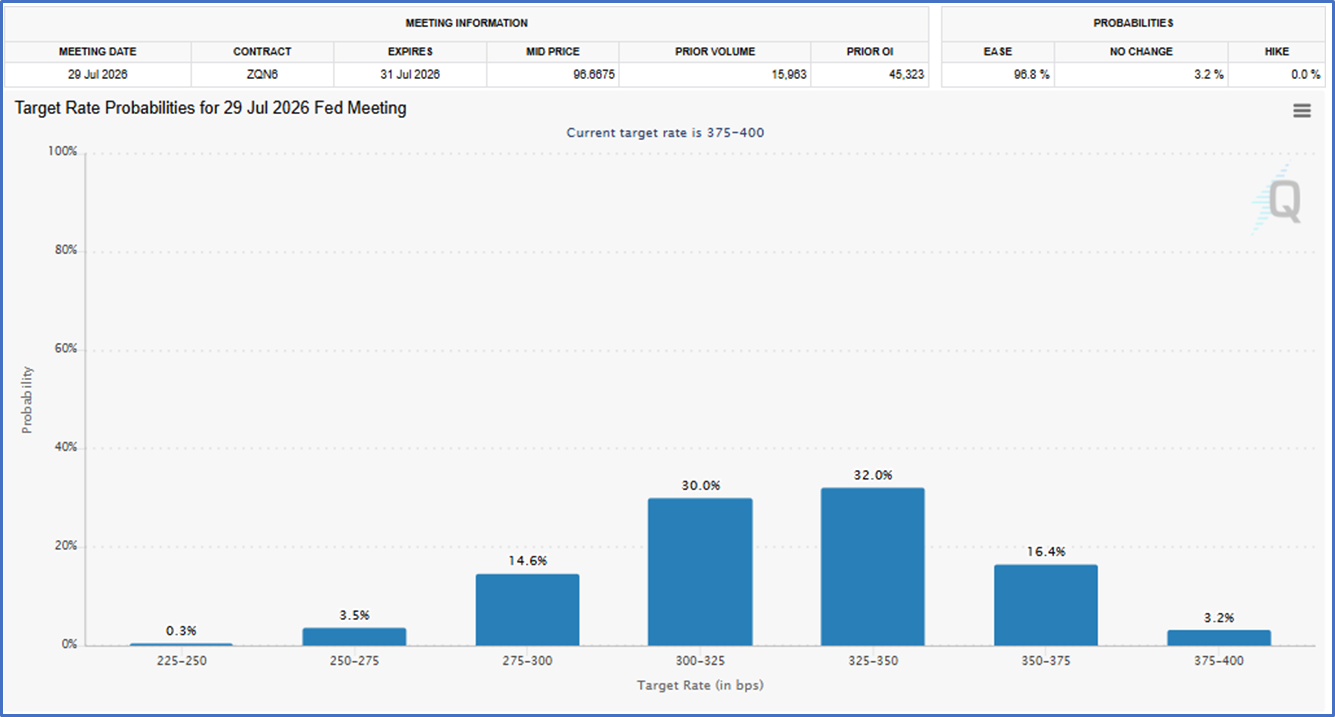
US Interest Rates
Interest rates have been cut twice this year as the Federal Reserve resumes its cutting cycle. Investors continue to optimistically price in additional 2 – 3 rate cuts by July 2026. Depending on the data regarding the labor market and economy, investors may be disappointed if the Fed communicates fewer cuts. This disappointment may cause some volatility in the equity and bond markets as both have already priced these cuts.
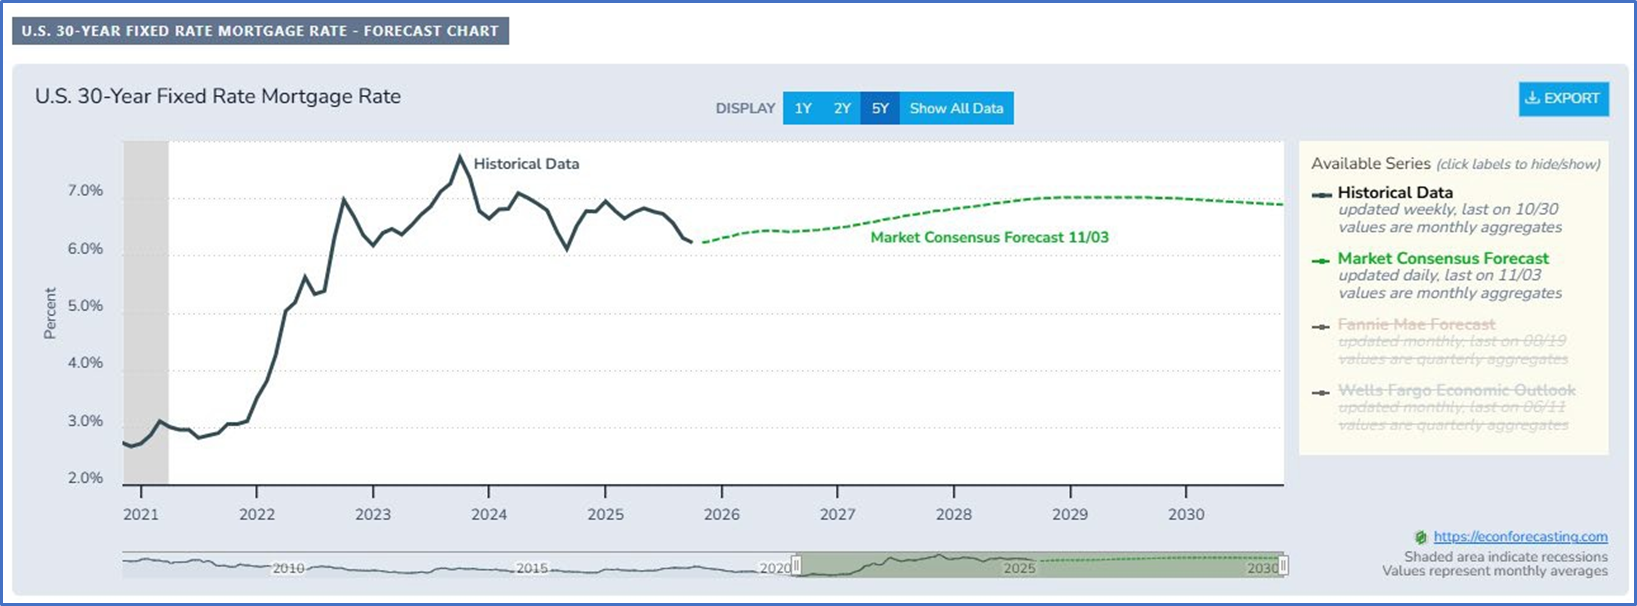
US Mortgage Rates
Mortgage rates may continue to decline as yields adjust to lower rates as shown below. The amount of decline in mortgage rates will be tied to how far the 10-year US Treasury yield falls assuming the demand for intermediate US Treasuries remains constant. If investors begin to question the credit worthiness of the US government, then US Treasury yields may remain the same or rise to entice global investors to continue to buy US government debt. So far, yields indicate that Treasury demand should remain strong.
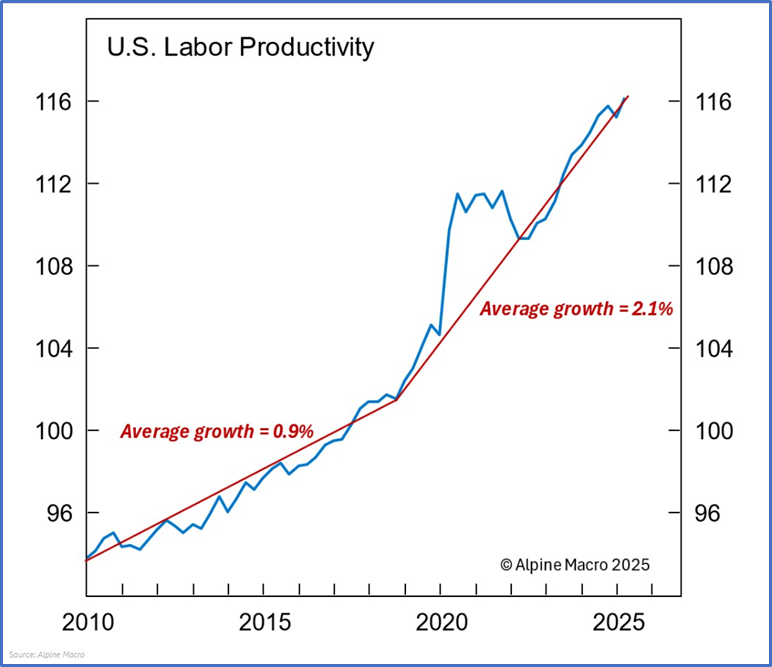
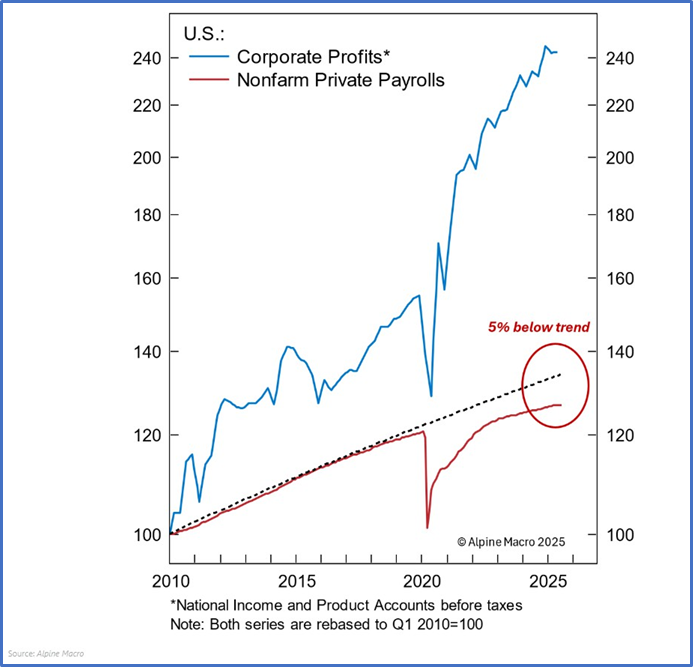
US Labor Productivity – Key to Earnings
US labor productivity has accelerated from an average growth of 0.9% to 2.1% (left chart). This means that companies are able to provide more goods/services for the same level of cost or provide the same level of goods/services at a lower cost. Either way, it causes corporate profits to increase. In fact, nonfarm private payrolls are still approximately five percent below trend from 2010. This means that technology has supplanted these jobs. With the increasing convergence of artificial intelligence and robotics, we envision that technology will continue to allow businesses to reduce labor costs relative to their sales; increasing their margins.
 |  |
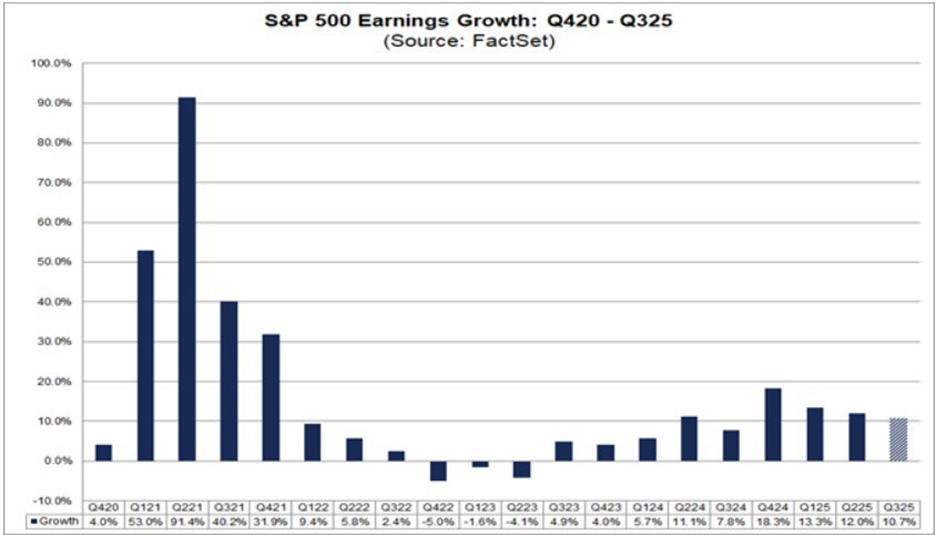
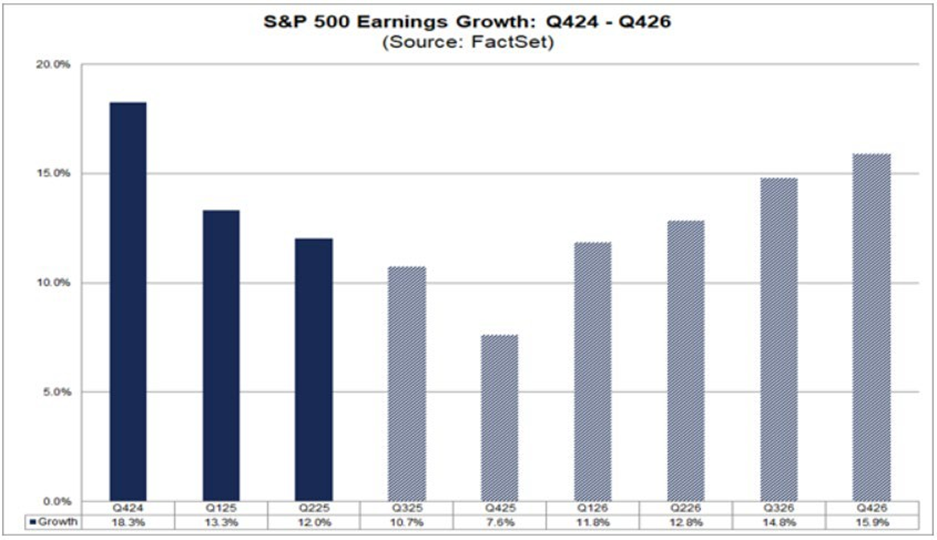
US Earnings
As discussed, lower labor costs have allowed corporations to increase profits over time. Below, we present Factset’s projections for quarterly earnings growth for the Standard & Poor’s 500 Index over the next few years. These forecasts will change based on new information; it still provides guidance as to the expected growth in earnings. Increasing earnings should provide equities with an opportunity for growth.
 |  |
| JWS Prediction |
Equities |
|
Fixed Income |
|
Real Assets |
|
GDP Growth |
|
Inflation |
|
Interest Rates |
|
Geopolitics |
|