


Juncture Wealth Strategies - July 2023 Market Update
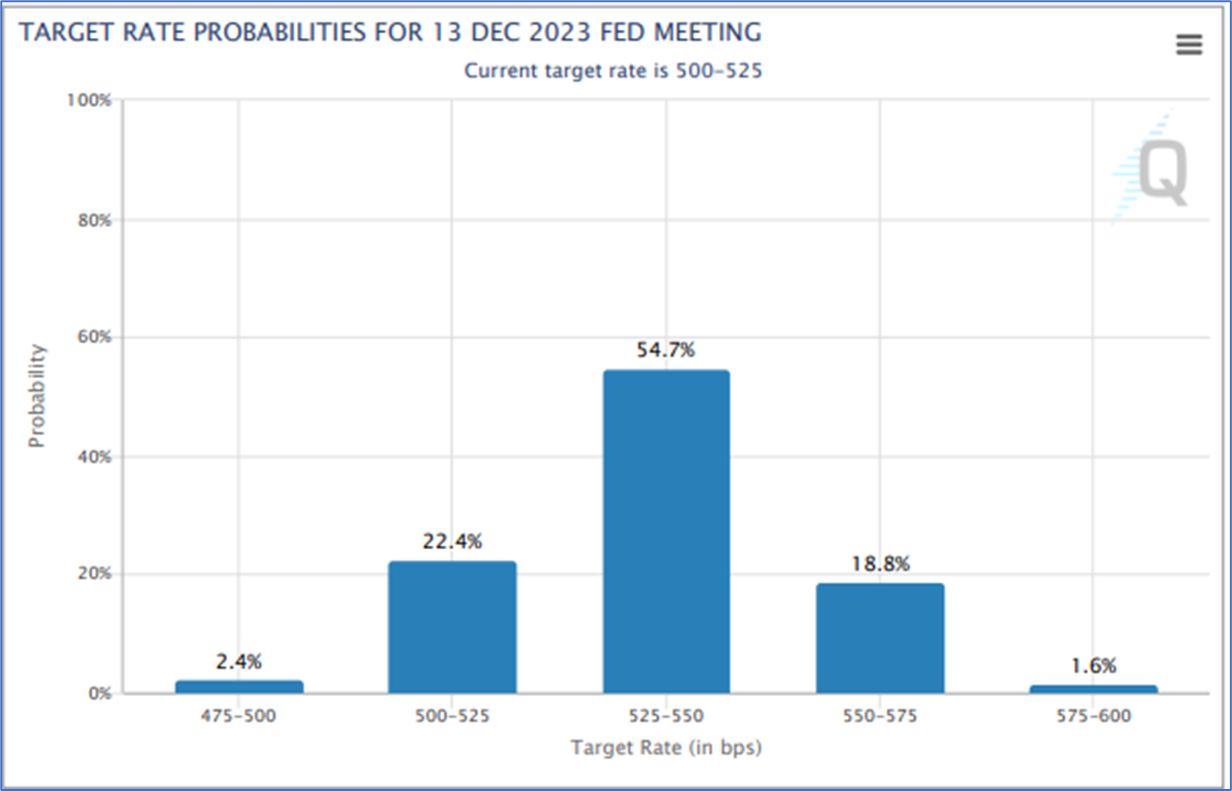
Higher Interest Rates in July
FOMC has reiterated their view that higher interest rates are needed to constrain inflation. The market is pricing in a 55% probability of the Fed Funds rate ending the year in the 5.25% - 5.50% range.
Fed Dot Plot
The Fed’s Dot Plot is each FOMC member’s expected future interest at various points in time. As shown below, the median interest rate for 2023 is between 5.50% - 5.75%. In future years, the median interest rate declines significantly.

Federal Reserve Balance Sheet
The Fed continues to reduce its balance sheet while increasing interest rates. This may become a bigger issue as tighter monetary policy begins to constrain liquidity.

Financial Conditions
An important part of any tightening cycle is to monitor any distress across the US financial markets. One such indicator is the Chicago Fed’s National Financial Conditions Index. It continues to indicate very little stress across markets.

Financial Conditions
Another indicator is the St. Louis Fed’s Financial Stress Index. It also continues to indicate low levels of stress across the US bond and stock markets.

Bank Credit and Money Supply
Bank credit is the primary transmission mechanism for the monetary base to affect the money supply. Banks make loans and those loans increase the money supply which can impact inflation. As shown, the total amount of loans/leases at commercial banks have stalled this year. It may indicate that inflation may continue to wane over the next six to twelve months.

Bank Credit and Money Supply
Another way of analyzing bank credit is to measure its change from a year ago. As shown, bank credit growth rate has declined rapidly since late 2022 which should constrain inflation.

Money Supply
Money supply is generally the fuel for inflation over a longer period of time. We analyze the change in various money supply measures to assess the likelihood of future persistent inflation. As shown, M1 and M2 peaked in 2022 and have declined since that time. We continue to expect disinflation for the remaining part of the year. As with all economic time series, we do expect some months to have higher inflation within a disinflationary trend.

US Consumer Price Index
Based on the contracting money supply, it is unsurprising to see that the US Consumers Price Index (CPI) which measures inflation for urban consumers has declined from approximately 9.0% to 3.1% last month. It is still above the Fed’s target of 2.0%. Shelter inflation is a large component of the CPI and has been elevated due to years of low interest rate policy.

CPI minus Shelter
The CPI minus Shelter provides a look into the other part of the inflation story. After factoring our Shelter, the CPI has declined from 10.8% to 2.1%. Shelter prices have significant lags and, as such, higher real estate prices and rentals continue to prop up the CPI. It is expected that Shelter will begin to constrain inflation in the near future.

Inflation: PCE
Personal Consumption Expenditure Index (PCE), the Fed’s preferred inflation measure, calculates the inflation for all US households and nonprofits. While the PCE has declined since June 2022 it remains stubbornly high.

New Inflation Indicator: Truflation
As technology and big data changes our lives, it has also reached economic indicators like inflation. A new company named Truflation uses curring edge data collection and analytic techniques to calculate the current inflation rate. It eliminates the lagged effect which can plague other inflation measures. It estimates it uses approximately 10 million data points versus 80,000 for traditional measures. If accurate, Truflation estimates current US inflation at 2.4% within the Fed’s target range.

Inverted Yield Curve
Media has focused on the yield curve inversion as a recessionary indicator. Historically, it has predicted most recessions , but it is far from perfect. The current inversions is one of the most pronounced and may indicate a future recession, but it also may forecast lower short term interest rates. If that occurs, the US may experience a soft landing or shallow recession where the Fed lowers rates in the next year or so.

Leading Economic Indicator (LEI)
The LEI continues to indicate recessionary levels. If it occurs, the recession may occur late 2023 or 2024.

Jobs Available per Unemployed Person
One reason the Fed is continuing its tighter monetary path is due to the number of jobs available to unemployed persons. It’s too tight for their comfort. A tight labor market increases the odds of reigniting inflation.

Average Hourly Earnings
Average hourly earnings inflation rate has declined but is still very elevated. It reinforces the Fed’s concern that a tight labor market may reignite inflation.

How will equities perform?
Many investors may wonder how stocks will perform given the strong index level returns year to date. Crandall Pierce analyzed this occurrence historically. When the market has ended the first six months with positive returns, it has finished the year with a positive return over 90% over the time. Given its extraordinary narrow breadth, the S&P 500 should finish the year strong with lagging stocks “catching up” with the seven mega cap tech stocks which have dominated so far.

Expect 2023 to be a year of transition with decent returns from global stocks. As shown above, we expect current leadership to start the transition from stocks which are US-based, have large capitalizations, and exhibit value characteristics to begin to include stocks which are international in scope, have smaller capitalizations, and exhibit more growth characteristics. Additionally, the US dollar may decline which will support international and commodity investments. Bonds may perform better than stocks during the first half of the year but may underperform stocks during the second half as stocks predict economic recovery.
Disclaimer: This newsletter is provided to you for informational purposes only. Any specific firm or security presented should not be construed as an endorsement or recommendation by Juncture Asset Management, LLC. No advice may be rendered by Juncture Asset Management, LLC unless a client service agreement is in place. Please consult with your financial advisor before making any investment. Information provided by Bloomberg is believed to be accurate but has not been verified.